TRANSIMS Visualizations at TRACC
TRACC is currently actively developing two separate visualization applications. One of these applications is 'Metropolis', developed by NCSA (the National Center for Supercomputing Applications), targets an interactive model that allows a modeler to navigate in three-dimensional space and time while displaying moving vehicles, dynamic volumes on the links, and many more such dynamic network features. The software is being developed based on OpenGL, and is comparable to the development of computer games, with fast rendering engines and highly interactive navigation. A fully functional prototype of the software is expected to be delivered in late spring 2010, and will be available to the transportation research community for free, just like TRANSIMS itself.
Work has also started on the development of 'TransimsVIS' a graphical user interface for the configuration of the visualization software.
The project will also benefit from the development of a new 'TRANSIMS RTE' graphical user environment (based on the concept of an integrated environment development) that is currently being developed by TRACC for the TRANSIMS community. This user interface will be integrated with the visualization application to allow an integrated approach to importing existing static four step models into TRANSIMS, running them through the TRANSIMS application, and creating dynamic visualizations.
TRANSIMS Rendering
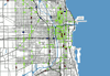
![]() Example of a higher quality rendering of a TRANSIMS case study. Frames such as the one shown here are rendered in a batch-driven GIS application from standard GIS layers and GIS files created by TRANSIMS. A series of hundreds or thousands of such images (for each fraction of a second) are them assembled into a video format.
Example of a higher quality rendering of a TRANSIMS case study. Frames such as the one shown here are rendered in a batch-driven GIS application from standard GIS layers and GIS files created by TRANSIMS. A series of hundreds or thousands of such images (for each fraction of a second) are them assembled into a video format.
Superimposing GIS Layers
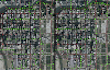
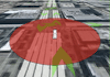
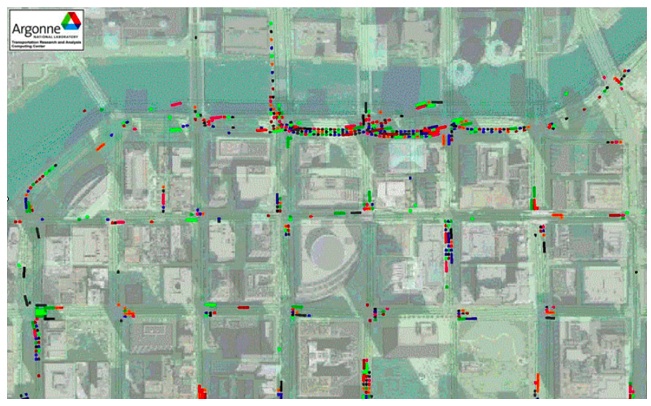 This sample frame from one of the typical visualizations illustrates how many different layers are superimposed. In this particular case, a layer with satellite imagery forms the basis, with semitransparent layers for waterways and building outlines (provided by CMAP). An additional roadway layer with lane by lane drawings created by TRANSIMS forms the street network. Finally, the individual vehicles are drawn in form of polygon GIS layers and full opacity on top of the other features. The last layer differs of course from each frame to frame for a give movie, making the vehicles move.
TransimsVIS
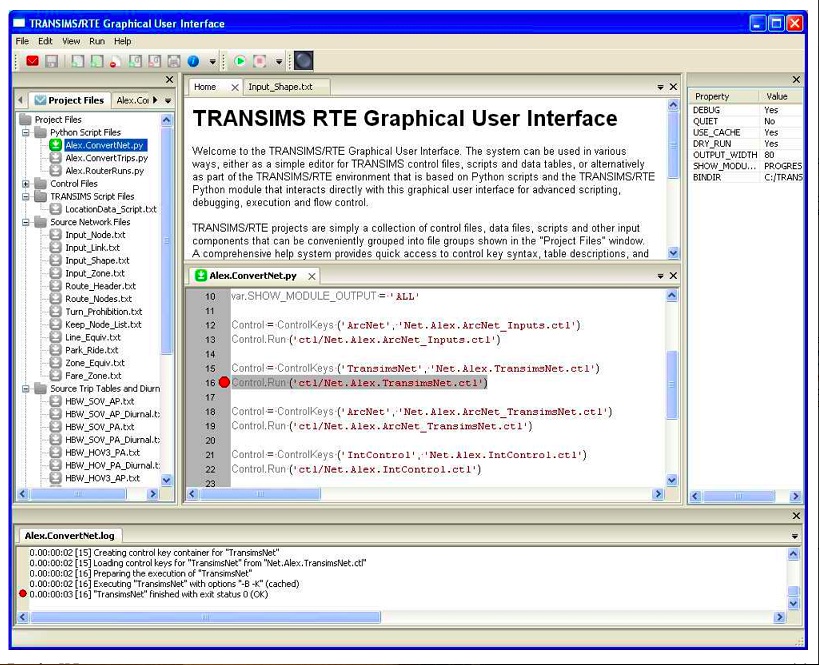
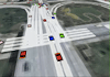
![]() This image illustrates a work-in-progress prototype of TransimsVIS, a graphical user interface for the TRACC visualization methodology. Up to date, researches had to edit script files describing the view and visualization parameters programmatically. With a graphical user interface, such tedious work can be significantly reduced, making the generation of specific scenarios with certain visual effects significantly easier to configure. While a high quality movies is still being rendered as a batch job, all aspects of the configuration are performed in the GUI, including limited preview capabilities to predict the final visual appearance of the video.
This image illustrates a work-in-progress prototype of TransimsVIS, a graphical user interface for the TRACC visualization methodology. Up to date, researches had to edit script files describing the view and visualization parameters programmatically. With a graphical user interface, such tedious work can be significantly reduced, making the generation of specific scenarios with certain visual effects significantly easier to configure. While a high quality movies is still being rendered as a batch job, all aspects of the configuration are performed in the GUI, including limited preview capabilities to predict the final visual appearance of the video.
TransimsIDE
 The TRANSIMS Integrated Development Environment (a new Graphical User Interface on top of a new Run Time Environment) is in a pre-alpha stage and is expected to become ready for initial deployment in the spring of 2010.
TransimsVIS Videos
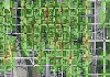
This video demonstrates how congestion develops over time by utilizing a "heat plot" which becomes hotter as more vehicles accumulate in a given area and cooler as they dissipate.
 Comparison of congestion from two separate regional microsimulations focused on the Elgion O'Hare Region.
 Simulation of some of the transit routes in the Elgin O'Hare region. Buses are drawn large so they are visible from the regional view. Circles around the buses indicate relative riderships among them.
 This video demonstrates the concept of "probe vehicles" in TransimsVIS. The software randomly selects a certain percentage of vehicles to display in "large" size so that you can get a quick aerial idea of which paths are quick and which are not.

 TransimsVIS allows quick visual analysis of large systems of traffic signals. In this animation the green "conveyors" move fluidly through sections of road where the traffic lights are green i.e. if you were a car along that conveyor you would see all green signals ahead of you. The conveyors dissipate to green outlines and finally red outlines right before there are no permitted movements, i.e. if you are a car following a red conveyor you would see a red traffic signal ahead.
 TransimsVIS now supports car following movies by attaching the back of the camera to a car. Additionally, this video showcases how interpolation can make even a second-by-second movie seem smooth.
 TransimsVIS now allows full 3D rotation. This movie demonstrates how basic camera movements can create a cinematic fly down from an aerial level to a street level. Notice how this movie integrates with the heat plot logic showing bursts of red where there is congestion, cooling back down to green when it dissipates.
 TransimsVIS has several features related to the display of transit vehicle such as buses. In this movie the circle indicates the relative number of passengers – notice how the size changes as people get on and off.
For further information contact: This email address is being protected from spambots. You need JavaScript enabled to view it.